

Technical Analysis of FTSE ST REIT Index (FSTAS351020)
FTSE ST Real Estate Investment Trusts (FTSE ST REIT Index) decreased from 676.08 to 653.16 (-3.39%) compared to last month's update. The REIT index is now trading in a downward channel, with the 20D SMA being the immediate resistance. It has broken the previous low in Oct 2022 (support) and has formed a new support at 611.
• Short-term direction: Down• Medium-term direction: Down
• Long-term direction: Down
• Immediate Support at 611 (previous low in Oct 2023)
• Immediate Resistance at 20D SMA, followed by 200D SMA
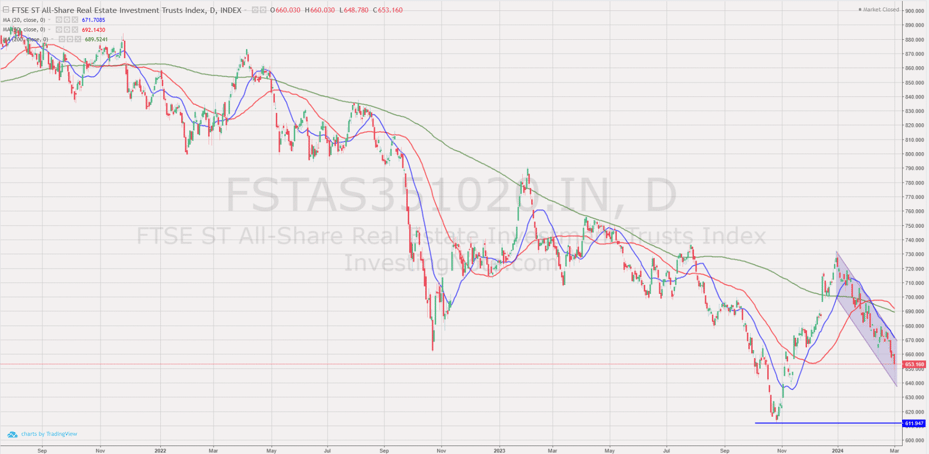
FTSE REIT Index Chart
Previous chart on FTSE ST REIT index can be found in the last post: Singapore REITs Monthly Update on February 11th, 2024.
Fundamental Analysis of 38 Singapore REITs
The following is the compilation of 38 Singapore REITs with colour-coding of the Distribution Yield, Gearing Ratio and Price to NAV Ratio.
- The Financial Ratios are based on past data and these are lagging indicators.
- REITs highlighted in cyan have the latest Q4 2023 update values, the rest have Q3 update values.
- I have introduced weighted average (weighted by market cap) to the financial ratios, in addition to the existing simple average ratios. This is another perspective where smaller market cap REITs do not disproportionately affect the average ratios.
Data from REITsavvy Screener. https://screener.reitsavvy.com/

What does each Column mean?
- FY DPU: If Green, FY DPU for the recent 4 Quarters is higher than that of the preceding 4 Quarters. If Lower, it is Red.
- Yield (TTM): Yield, calculated by DPU (trailing twelve months) and Current Price as of March 1st, 2024.
- Gearing (%): Leverage Ratio.
- Price/NAV: Price to Book Value.
- Formula: Current Price over Net Asset Value per Unit.
- Yield Spread (%): REIT yield (TTM) reference to Gov Bond Yields. REITs trading in USD is referenced to US Gov Bond Yield, everything else is referenced to SG Gov Bond Yield.
Price/NAV Ratios Overview
- Price/NAV increased to 0.79. (Weighted Average: 0.79)
- Remained from 0.79 in January 2024.
- Singapore's Overall REIT sector is very undervalued now.
- Price/NAV increased due to NAV trending downwards from the latest Q4 2023 update.
- Most overvalued REITs (based on Price/NAV)
|
EC World REIT |
2.33 |
|
ParkwayLife REIT |
1.51 |
|
Keppel DC REIT |
1.26 |
|
Capitaland Ascendas REIT |
1.24 |
|
Mapletree Industrial Tr |
1.22 |
|
Mapletree Logistics Tr |
1.04 |
- Only 6 REITs are overvalued now based on Price/NAV value.
- EC World REIT has its NAV/Unit dropped from 0.75 to 0.12 as of the latest update. This caused its Price/NAV to skyrocket to 2.33.
- Most undervalued REITs (based on Price/NAV)
|
Manulife US REIT |
0.17 |
|
Keppel Pacific Oak US REIT |
0.18 |
|
Prime US REIT |
0.19 |
|
Lippo Malls Indonesia Retail Trust |
0.27 |
|
ARA Hospitality Trust |
0.38 |
|
OUE REIT |
0.44 |
Distribution Yields Overview
- TTM Distribution Yield decreased to 7.96%. (Weighted Average is 6.32%)
- Decreased from 8.21% in February 2024 (Weighted Average was 6.32%)
- 19 of 38 Singapore REITs have TTM distribution yields of above 7%.
- Do take note that these yield numbers are based on current prices taking into account the delayed distribution/dividend cuts due to COVID-19, and economic recovery.
- 7 REITs have a TTM yield of over 10%!
- Highest Distribution Yield REITs (TTM)
|
Prime US REIT |
23.77 |
|
Keppel Pacific Oak US REIT |
19.69 |
|
Elite Commercial REIT |
13.68 |
|
ARA Hospitality Trust |
12.25 |
|
Daiwa House Logistics Trust |
12.23 |
|
Cromwell European REIT |
10.97 |
- A reminder that these yield numbers are based on current prices. This has caused Prime US REIT's and Keppel Pacific Oak REIT's TTM yields to be over 25%, despite the distribution cuts/halts.
- Some REITs opted for semi-annual reporting and thus no quarterly DPU was announced.
- A High Yield should not be the sole ratio to look for when choosing a REIT to invest in.
- Yield Spread tightened to 4.69%. (Weighted Average widened slightly to 3.91%)
- Tightened from 5.07% in February 2024. (Weighted Average was 3.85%)
Gearing Ratios Overview
- Gearing Ratio increased slightly to 38.76%. (Weighted Average: 37.89%)
- Increased from 38.06% in February 2024. (Weighted Average: 38.86%)
- Gearing Ratios are updated quarterly.
- S-REITs Gearing Ratio has been on a steady uptrend. It was 35.55% in Q4 2019.
- Highest Gearing Ratio REITs
|
EC World REIT |
58.3 |
|
Manulife US REIT |
58.3 |
|
Prime US REIT |
48.4 |
|
Lippo Malls Indonesia Retail Trust |
44.3 |
|
Keppel Pacific Oak US REIT |
43.2 |
|
Suntec REIT |
42.3 |
- MUST and EC World REIT's gearing ratio has exceeded MAS's gearing limit of 50%. However, the aggregate leverage limit is not considered to be breached if exceeding the limit is due to circumstances beyond the control of the REIT Manager.
Market Capitalisation Overview
- Total Singapore REIT Market Capitalisation decreased by 8.87% to S$87.49 Billion.
- Decrease from S$90.08 Billion in February 2024.
- Decrease from S$90.08 Billion in February 2024.
- Biggest Market Capitalisation REITs (S$ Million):
|
Capitaland Integrated Commercial Trust |
12701.50 |
|
Capitaland Ascendas REIT |
11913.60 |
|
Mapletree Logistics Tr |
7256.20 |
|
Mapletree Pan Asia Commercial Trust |
6930.00 |
|
Mapletree Industrial Tr |
6395.80 |
|
Frasers Logistics & Commercial Trust |
3852.20 |
- There have been no changes in the rankings since November 2022.
- Smallest Market Capitalisation REITs (S$ Million):
|
Manulife US REIT |
104.88 |
|
Lippo Malls Indonesia Retail Trust |
115.50 |
|
Elite Commercial REIT |
120.74 |
|
Keppel Pacific Oak US REIT |
132.08 |
|
Prime US REIT |
135.66 |
|
ARA Hospitality Trust |
161.90 |
Disclaimer: The above table is best used for “screening and shortlisting only”. It is NOT for investing (Buy / Sell) decisions.
Top 20 Worst Performers of February 2024
Source: https://screener.reitsavvy.com/

SG 10-Year & US 10-Year Government Bond Yield
- SG 10 Year: 3.11% (increased from 2.98%)
- US 10 Year: 4.18% (increased from 4.18%)

Summary
The past month was a bearish month for S-REITs again. This can be possibly caused by the continued increase in SG/US 10 Years Gov Bond Yields (highly inversely correlated with FTSE ST REIT Index in 2023) and poor earnings release by most of the REITs (which DPU was expected to drop YoY due to the full impact of interest rate hikes). Fundamentally, the whole Singapore REITs landscape remains undervalued based on the average Price/NAV (at 0.79) value of the S-REITs, with still a very attractive DPU yield of 7.96%! (Weighted average yield of 6.45%). Do take note that NAV and DPU are lagging numbers.
The earnings reporting season has ended for Q4 2023. The following are the summary q-o-q / h-o-h results for the S-REITs:
10 REITs reported an increase in DPU,
19 REITs reported a decrease in DPU,
6 REITs reported no change in DPU.
Weighted Average Yield spread (in reference to the 10-year Singapore government bond yield of 3.11% as of 10th February 2023) widened slightly from 3.86% to 3.91%. Based on the CME group's interest rate futures, there will be a high possibility of rate cut of between 100-150 bps by end of 2024.

Technically the REIT Index has broken the previous support of about 665, and now has a new support at 611 (previous low in Oct 2022).
Trends and Predictions for Singapore REITs 2024
Join us for an enlightening webinar where we delve into the intricate world of Real Estate Investment Trusts (REITs) in Singapore against the backdrop of interest rate movements. Kenny Loh, a Singapore REIT Specialist and Independent Financial Advisor, will meticulously analyse current market trends and offer valuable insights into the potential risks and opportunities that lie ahead for S-REITs in 2024.
Key Topics Covered:
- Impact of Interest Rate Movements on Singapore REITs Performance
- Navigating Interest Rate Fluctuations
- Identifying Emerging Risks and Seizing Opportunities in REITs Sector
- Actionable Insights for Portfolio Positioning
- Strategic Success Amidst Interest Rate Scenarios
Kenny Loh is a Wealth Advisory Director and REITs Specialist of Singapore’s top Independent Financial Advisor. He helps clients construct diversified portfolios consisting of different asset classes from REITs, Equities, Bonds, ETFs, Unit Trusts, Private Equity, Alternative Investments, Digital Assets and Fixed Maturity Funds to achieve an optimal risk-adjusted return. Kenny is also a CERTIFIED FINANCIAL PLANNER, SGX Academy REIT Trainer, Certified IBF Trainer of Associate REIT Investment Advisor (ARIA) and also an invited speaker of REITs Symposium and Invest Fair. You can join my Telegram channel #REITirement – SREIT Singapore REIT Market Update and Retirement-related news. https://t.me/REITirement